Module 2 Forestry and LiDAR
This week's Module 2 we were working with LiDAR data. This data is useful to foresters to help better understand the forest and terrain. We learned in this week's lab that creating these map analyst helps with forest management and operational activities. For calculating forest biomass, identifying drainage patterns and for overall health of the forest and so on.
Some of this week's learning outcomes were the ability to download decompression software for unzipping .las files to be used in ArcGIS, being able to create a DEM and DSM from LiDAR data and to be able to calculate forest height and forest biomass from LiDAR.
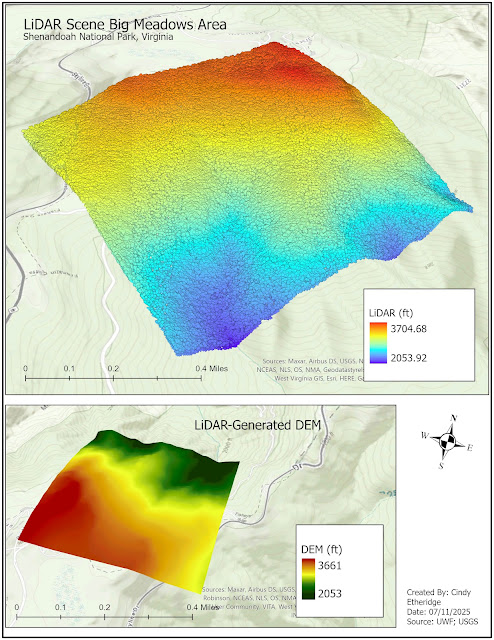
Here above I have a map of the LiDAR scene of the Big Meadows Area in Shenandoah National Park, Virginia. With a DEM (Digital Elevation Models) map of the same area. Some of the tools used for creating the LiDAR Scene and the DEM model were the LAS tool and the LAS Dataset to Raster tool.
Here above is a map of the height of the vegetation and a chart showing the distribution of the tree heights. For the symbology I chose to go with lowest=lightest color to highest=darkest color. Which really allows you to see the density of the forest and where the more mature forest is located. You can also see where the man-made roads go through. The chart shows you that the majority of the trees range between 40ft-80ft with the average height being around 54.4ft. Some of the tools used here were the LAS Dataset to Raster tool and the Minus tool and going to the Data tab to Create and selecting Histogram was used to create the chart.
Here above is a map of the canopy density. For the symbology I have it set to yellow for the low density and dark blue for the high density. This map clearly shows where the vegetation is thickest and where there is no vegetation at all. This is useful to foresters to help locate areas that may be overgrown and need thinning to help prevent fires. This kind
of map can also help foresters to plan for where to put trails or roads, likely
in the lower density areas minimizing environmental impact. There was several geoprocessing tools used. Just to name a few are Las to Multipoint tool, Point to Raster tool, IS NULL tool etc... followed up with the Divide tool to calculate the density.


Comments
Post a Comment